


Introduction
Apache Hadoop provides a robust and economic platform for storing and process big data. R programming language is used by many data analysts for statistical analysis. In this article, I talk about putting these two together to form a powerful platform for big data analysis.
Apache Hadoop
Apache Hadoop has become synonymous with Big Data. Nobody talks about Big Data without doing something with Hadoop. Hadoop helps to complete your job faster by distributing the computations to a cluster of commodity machines. This makes it possible for organizations to cut their data management costs by as much as 90% and yet build a fault-tolerant data processing system.
Hadoop has two core components, HDFS for distributed storage and Mapreduce for distributed processing. The hadoop architecture can be represented by the below diagram.
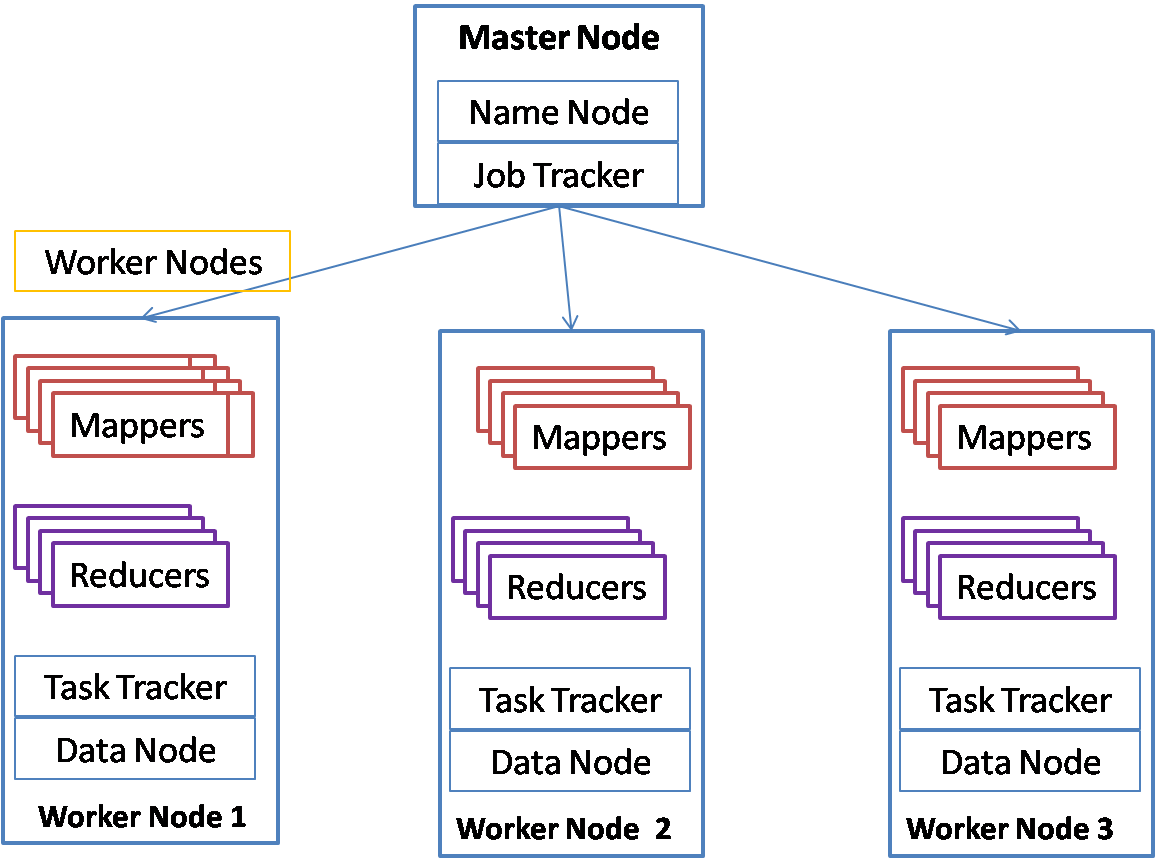
Hadoop cluster consists of two types of nodes (or machines). There is one master node and multiple worker nodes. Name node and data node are processes that are part of HDFS, Hadoop distributed file system. Job tracker and Task tracker are part of Map reduce – the distributed processing system of hadoop. User jobs are divided into two types of tasks, mappers and reducers. Mappers do the filtering of data and convert the data into key value pairs. Reducers process each key and produce an aggregated output. Mappers take the input from HDFS and store their output in local file system. Reducers get the output of mappers and store the final output in HDFS. Since all mappers and reducers have a share nothing architecture, hadoop provides a very highly scalable parallel processing architecture.
R Programming language
R programming language has been used for statistical computing. With the increased interest in data analytics, usage of R has increased significantly. It is estimated that more than 70% of the data scientists use R for statistical analysis. R is an opensource product and is free. It is supplied as part of the GNU public license. R has outperformed many of the expensive and paid products for statistical processing. The R language itself is easy to learn and provides many libraries that provide functions to model and analyze data. R also provides extensive libraries for prediction as well as machine learning.
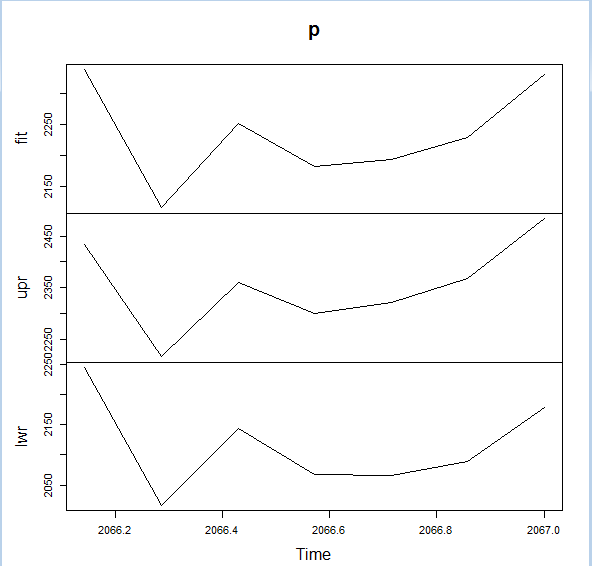
R provides many built in functions for machine learning as well as prediction modeling. One of my favorite is Holt-Winters model that provides time series modeling of data with some randomness, trend as well as seasonality. It is also called the triple exponential model. For example ,if you have data in a file that has a single column as sales per day for the last five years for a particular store, then you can build a Holt Winters model like below:
>salesTS <- ts(sales,frequency=52,start=c(2010,1))
>hw<-HoltWinters(salesTS, seasonal=”add”, alpha=0.3,beta=0.2,gamma=12)
>p<-predict(hw,8,prediction.interval=TRUE)
>plot(p)
You will get the graph like below which gives the 8 future points along with upper and lower bounds:
R-Hadoop
Now, can we put the power of hadoop and convenience of R together? R-hadoop is one such attempt. You write your mapper and reducer functions in R and the jobs are submitted to Hadoop which in turn distributes the work to R running on each machine in the cluster. The architecture can be represented in the below diagram:
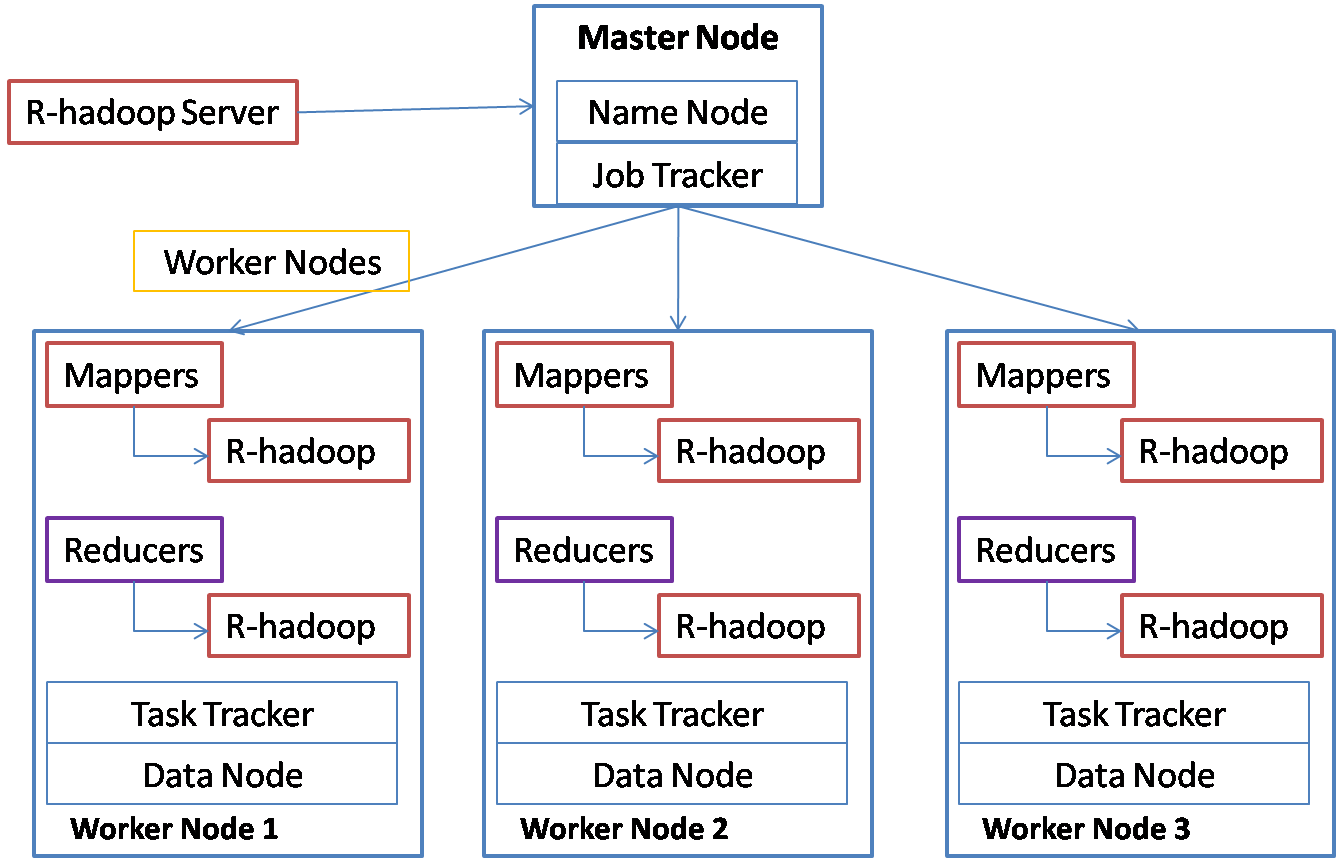
You can initiate your map-reduce job through the R-hadoop server. R-hadoop server submits the job to Job Tracker. Job tracker schedules the map and reduce tasks on task trackers running on each worker node. The map and reduce tasks execute the tasks by running the mapper code on the R-hadoop on the worker node. The R-hadoop mapper gets the input as keys and values, processes the data and stores them again as keys and values for the reducer. The reducer task collects the keys and values and calls the reduce function on R-hadoop for each key with a list of values. R-hadoop does not parallelize the algorithm itself. It distributes the work so that keys and values are distributed. Suppose you have to execute the above prediction for 200 stores and for each store it takes 10 minutes, then you can distribute this work on your hadoop cluster so that all the 200 stores can be processed within an hour.
Installation and setup
Though R-hadoop is not difficult to setup, it takes lot of trial and error to make it work properly. Following steps need to be followed to set this up correctly:
On each machine in the cluster:
- Do a package installation of R (on Ubuntu, you can add the line deb http://ftp.osuosl.org/pub/cran/bin/linux/ubuntu precise/
to /etc/apt/sources.list and then use apt-get to install r-base and r-base-dev)
2. Start R with sudo R and add the following packages:
(“codetools”, “Rcpp”,”plyr”,”stringi”,”magrittr”,”stringr”,”reshape2″,”caTools”,”functional”, “digest”, “RJSONIO”)
- Quit to Linux command line and download the rmr package from any of the mirrors. Following is one of the mirrors:
wget http://github.com/RevolutionAnalytics/rmr2/releases/download/3.3.1/rmr2_3.3.1.tar.gz
- Install the package using the below command:
sudo R CMD INSTALL rmr2_3.3.1.tar.gz
If it throws up any errors that some package is missing or outdated, reinstall that package and try again.
Following steps need to be executed on the master node only:
- Install R studio server on the master node. I found following instructions for installing R studio server that is very useful:
sudo apt-get install gdebi-core
wget http://download2.rstudio.org/rstudio-server-0.99.464-i386.deb
sudo gdebi rstudio-server-0.99.464-i386.deb
This automatically starts Rstudio server, so after we make the configuration changes, you will have to restart the server.
6. This is an important step for connecting the server to hadoop. Find out your hadoop installation path and hadoop streaming jar file and set two environment variables as below:
Edit the/etc/R/Renviron.site file and add the below lines at the end:
#following required for R-Hadoop
HADOOP_CMD=/usr/local/hadoop/bin/hadoop
HADOOP_STREAMING=/usr/local/hadoop/contrib/streaming/hadoop-streaming-1.2.1.jar
Your hadoop path and jar file may be different based on your hadoop version.
7. Now you need to restart Rstudio server for above changes to take effect:
sudo rstudio-server restart
8. You can connect to the Rstudio server from a browser on any machine with the ip address of the server machine and port 8787. I use firefox and it comes up fine. It asks for an id and password that will be a user id and password on the Linux system.
9. You will get a screen like below when you login and you are all set to use R-hadoop:
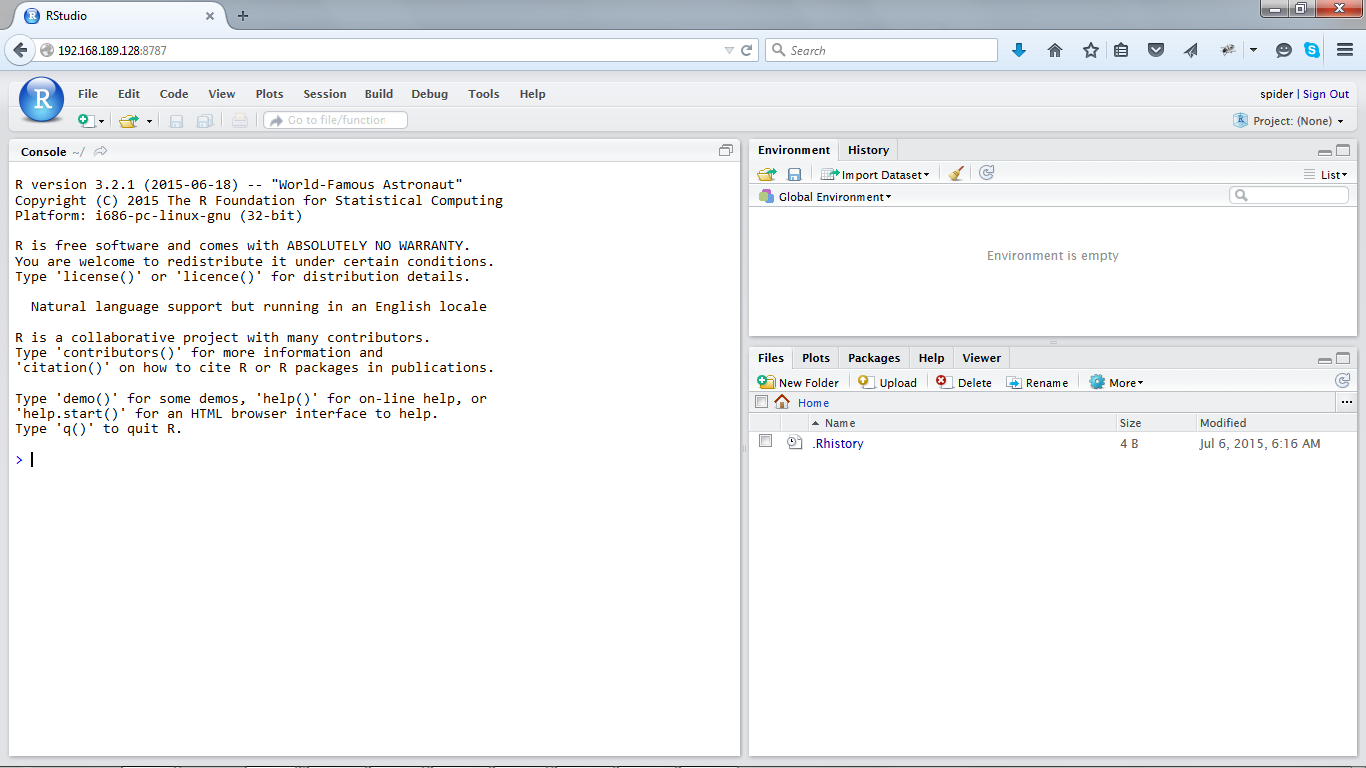
I have used the Linux user id spider that was created using sudo adduser spider.
Running a sample program From Rstudio
we can submit hadoop jobs from Rstudio. We need to write a mapper function and a reducer function and then call the mapreduce function in rmr2 package to submit the job to hadoop.
Step 1.
Create the input files in HDFS. I will use a file with retail sales data for multiple stores with the below format as the input file:StoreId,date of sale,total daily salesNYT1,2010-01-01,1221NYT1,2010-01-02,1206
NYT1,2010-01-03,1001
NYT1,2010-01-04,1193
NYT1,2010-01-05,1067
NYT1,2010-01-06,1077
NYT1,2010-01-07,1131
NYT1,2010-01-08,1250
NYT1,2010-01-09,1261
NYT1,2010-01-10,1009
hadoop fs –mkdir data/in
hadoop fs -put sales.csv data/in/sales.csv
Step 2.
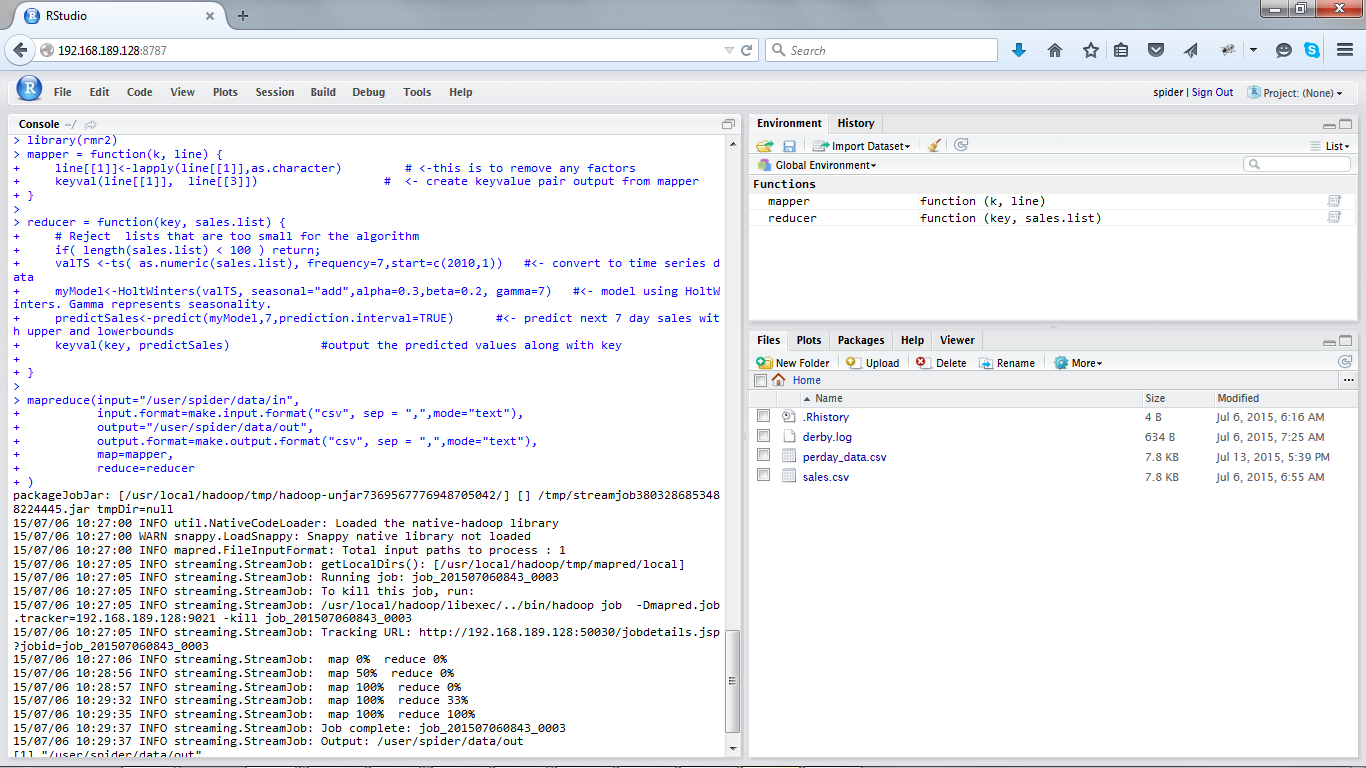
Write the mapper in Rstudio:
library(rmr2)
mapper = function(k, line) {
line[[1]]<-lapply(line[[1]],as.character) # <-this is to remove any factors
keyval(line[[1]], line[[3]]) # <- create keyvalue pair output from mapper
}
Note that the mapper gets one input split of data as a list. So line above is not a single line but a list of lines. Since R is good a t vector processing, it makes sense not to call mapper for each line of input.
Step 3.
Write the reducer in Rstudio. We will use my favorite HoltWinters for triple exponential smoothing and prediction.
reducer = function(key, sales.list) {
# Reject lists that are too small for the algorithm
if( length(sales.list) < 100 ) return;
valTS <-ts( as.numeric(sales.list), frequency=7,start=c(2010,1)) #<- convert to time series data
myModel<-HoltWinters(valTS, seasonal=”add”,alpha=0.3,beta=0.2, gamma=7) #<- model using HoltWinters. Gamma represents seasonality.
predictSales<-predict(myModel,7,prediction.interval=TRUE) #<- predict next 7 day sales with upper and lowerbounds
keyval(key, predictSales) #output the predicted values along with key
}
Step 4.
Finally submit the mapreduce job: mapreduce(input=”/user/spider/data/in”, input.format=make.input.format(“csv”, sep = “,”,mode=”text”), output=”/user/spider/data/out”, output.format=make.output.format(“csv”, sep = “,”,mode=”text”), map=mapper, reduce=reducer )
Note that absolute paths are specified for the input and output.
You will see mapreduce job executing like below:
You can check the output using hadoop. For just one store, it will look like below:
hadoop fs –cat data/out/part*
NYT1,2338.51949369753,2432.89119831428,2244.14778908078
NYT1,2116.48417153055,2216.78491253985,2016.18343052126
NYT1,2251.52104468871,2359.36936564803,2143.67272372938
NYT1,2183.65383703299,2300.62907811683,2066.67859594915
NYT1,2193.71659308069,2321.31048815327,2066.12269800812
NYT1,2228.88574017237,2368.47932443543,2089.2921559093
NYT1,2330.63829440411,2483.49715245174,2177.77943635647
The lines contain the store id, predicted value, upper bound and the lower bounds for the next 7 days. If there are multiple stores in the input, then each store will have 7 lines each.
Behind the scenes
The map reduce job is submitted to hadoop by the Rstudio server. Hadoop in turn uses the streaming jar with the mapper and reducer functions. The mapper function is run on R (Separate instance from Rstudio server) and the output key values are sent to reducer. Reducer function is run on another instance of R. The input for the reducer is consolidated from the mappers and all the key values are grouped together. Finally the reducer output is stored back into HDFS.
Advantages of R-hadoop
R-hadoop distributes your R jobs on multiple machines on the cluster. This enables parallel processing if similar R functions have to be run on multiple keys. For example if same analysis has to be done on 10000 customers of a bank, 5000 stores of a retail chain, thousands of credit card customers, millions of customer transactions etc. Though individual algorithm is not distributed, each key can be processed in parallel, leading to significant time savings.
Disadvantages of R-hadoop
Since each map or reduce task runs on separate R instances, the overhead per task is more. Also if you have an algorithm that runs on large amount of data for hours, then R-hadoop does not help in parallelization of the algorithm.
R-hadoop and EMR
EMR is the elastic map reduce service provided by Amazon Web Services. EMR allows one to provision a hadoop cluster on demand and release the resources once the job is done. EMR provides bootstrap scripts that enable you to install any required software before the mapreduce job is started. Using the bootstrap scripts, one can set up R-hadoop on the cluster including the R-server and submit the jobs automatically or through the browser. We did this for an enterprise so that they could also install graphic analysis libraries along with R and run R jobs on hadoop to get the analysis results through EMR.
Conclusion
R-hadoop is very convenient for distributing your analysis using R so that processing for multiple keys can be distributed across the cluster. Those data-scientists who are well versed with R will find it very easy to use R-hadoop. For cases where algorithm itself has to be parallelized, R-hadoop may not be useful and other alternatives like Spark machine learning library may be used.
Some references:
https://en.wikibooks.org/wiki/R_Programming:
http://www.revolutionanalytics.com/what-r
bout the Author

Ganapathi is a practicing expert in Big data, SAP HANA and Hadoop. He has been managing database projects for many years and is consulting clients on Big Data implementations. He is a Cloudera certified Hadoop administrator and also a Sybase certified database administrator. He has worked with clients in US, UK, Australia, Japan and India on many large projects. He has helped in implementing large database projects in Sybase, Oracle, Informix, DB2, MySQL and recently SAPHANA. He has been using big data technologies like Apache Hadoop, SAP HANA and Apache Cassandra and has been providing strategies for dealing with large databases and performance issues and helping in setting up big data clusters. He also conducts lot of trainings on Big Data and hadoop ecosystem of products like HDFS, mapreduce, hive, pig, Hbase, sqoop, flume, Cassandra and Spark. He is based out of Bangalore, India. He can be reached at ganapathid@spideropsnet.com.
This is a very prepared article. It is very helpful.
Needed to compose you a very little word to thank you yet again regarding the nice suggestions you’ve contributed here.
Very brilliant work.Its my duty to say you cleared me lots of doubts in hadoop through your flow diagrams,architecture and graph comparisons.