

By Ganapathi Devappa
When I talk to clients, they are curious about what type of forecasting can be done with their existing data. Here I touch upon some methods that can be used right away based on your historic data.
Types
One of the uses of existing data is forecasting based on historic data. There can be two types of forecasting, short term and long term. While long term forecasting takes more time and need to take into account lot of external factors that may affect the outcome, short term forecasting can be done quite accurately with historic data alone. That said, there has to be disclaimer that forecasting is always an estimate and there is no guarantee that it will match the actual.
Forecasting Use Cases
There are many use cases where forecasting can be used. In logistics industry, the expected cargo for each month over the next year can be forecasted. For power transmission organization, the expected power load at each substation over the next day or week can be forecast as short term forecast to plan power supply. For retail shops, the demand for certain items at their stores can be predicted for next few months. For stock brokers, the performance of few stocks can be predicted over the next few days.
How much data?
How much historic data is needed for forecasting? For some industries like stock market, the cycle period is quite long (17-30 years) so, long term data is needed. For most industries, about 5 years data should be enough to forecast for short term.
Clean Data
Main problem we face with clients normally is not what tools or method to use for forecasting but how to get clean data for forecasting. Common complaint I get from data analysts is that they ask for data and they don’t get the data even after 2-3 months. Because most organizations don’t have clean data that they cans share with the data analysts. Engineers hesitate to share raw data they have that may be missing few months of data. It is always better for the data analysts or data scientists to sit with the engineers and extract the data they need.
R, the free tool for data analysis
Once you have the data, there is an opensource tool called R (http://www.r-project.org/) that can be downloaded and used free of charge. This tool is used by many data analysts (as much as 70% as per some survey). It has rich features including data import and data visualization using plotting. R has many packages that can be used for data analysis as well as forecasting. The library stats that is loaded by default has lot of analysis tools and the library ‘forecast’ can be loaded to run forecasting functions. I want to mention here a couple of functions used in forecasting.
Holt Winters Method
One package that can be used for forecasting is HoltWinters that uses triple exponential smoothing for curve fitting and forecasting. This method takes into account the randomness, trends as well as the seasonal components in the data for accurate forecasting. At least two seasons of data is required for the forecast.
ARIMA Method with seasonal correction
Another popular method for forecasting is auto regressive integrated moving averages or ARIMA. As the name indicates, it uses auto regression and moving averages for curve fitting. It expects stationary time series data and differencing method is used to obtain a stationary time series from non-stationary series and hence the ‘integrated’ in the name. For seasonal data, one more cyclic component is included in ARIMA. R provides an auto.arima function that evaluates the data to figure out the ARIMA parameters and seasonal components to be used for the curve fitting.
Here I present a five years historic data from a logistics company being used to forecast the next 12 months cargo.
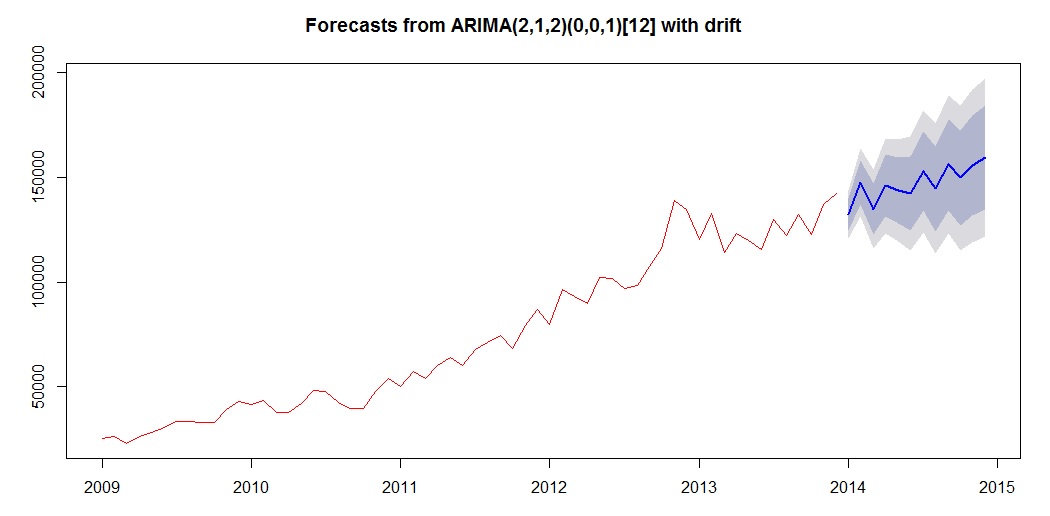
The red line above represents the historic data (5 years monthly data) and the blue line represents the forecast for the next 12 months. The grey bands above and below the blue line represent the 80% and 95% confidence bands. Note that the R function has recognized the 12 month seasonal cycle in data.
SAP HANA Database
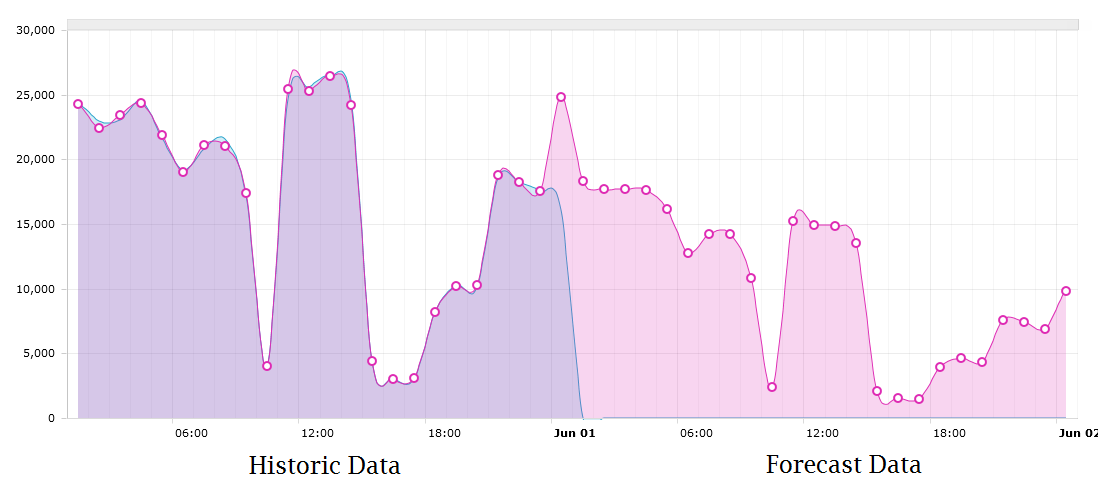
If you are using SAP HANA database, you can use the AFL library in SAP HANA that has built in procedures for forecasting. The image at the top of this blog is produced by SAP HANA triple exponential smoothing procedure for short term forecasting of power transmission load.

Ganapathi is an expert in data and databases. He has been managing database projects for many years and now is consulting clients on Big Data implementations. He is a Cloudera certified Hadoop administrator and also a Sybase certified database administrator. He has worked with clients in US, UK, Australia, Japan and India on many large projects. He has helped in implementing large database projects in Sybase, Oracle, Informix, DB2, MySQL and recently SAPHANA. He has been using big data technologies like Apache Hadoop and SAP HANA and has been providing strategies for dealing with large databases and performance issues. He is based out of Bangalore, India. He can be reached at ganapathid@spideropsnet.com.